
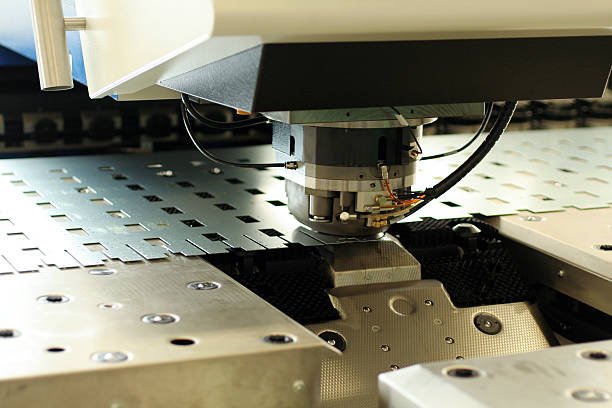
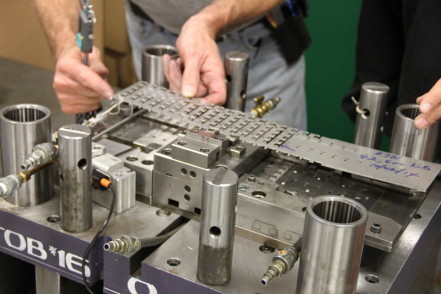
Understanding how to interpret a forming limit diagram is essential for anyone involved in steel stamping, whether you’re a process engineer, quality manager, or production supervisor. These diagrams are powerful tools for predicting the formability of sheet metal and preventing costly defects such as cracks or wrinkles during the stamping process. By learning to read and apply these charts, you can optimize your tooling, reduce scrap rates, and ensure consistent part quality.
Before diving into the details, it’s helpful to connect this topic with related aspects of metal forming. For example, if you’re working with coated steels, you may want to review the best practices for stamping coated steels to avoid surface damage while maximizing formability. Similarly, understanding the limits of steel formability can help you set realistic expectations for your stamping operations.
What Is a Forming Limit Diagram?
A forming limit diagram (FLD) is a graphical representation used to evaluate the forming capability of sheet metals, especially steels, during stamping. It plots the major and minor strains that a material can undergo before failure. The diagram helps engineers visualize the safe and unsafe zones for metal deformation, guiding decisions about die design, process parameters, and material selection.
Typically, the FLD displays a curve—known as the forming limit curve (FLC)—that separates safe forming regions from areas where defects like necking or cracking are likely to occur. Points below the curve indicate safe deformation, while points above signal a risk of failure. This makes the FLD an indispensable reference for troubleshooting and process optimization in steel stamping.
Key Elements of a Forming Limit Diagram
To effectively use an FLD, it’s important to understand its main components:
- Major Strain (X-Axis): Represents the largest stretch experienced by the sheet metal in one direction.
- Minor Strain (Y-Axis): Indicates the strain perpendicular to the major strain, which can be tensile or compressive.
- Forming Limit Curve (FLC): The boundary line that distinguishes between safe and failure zones.
- Safe Zone: The area below the FLC where the material can be formed without risk of necking or cracking.
- Failure Zone: The region above the FLC where defects are likely to occur.
Some diagrams may also include additional lines for specific failure modes or material conditions, but the core elements remain consistent.
Steps for Interpreting a Forming Limit Diagram in Steel Stamping
Applying an FLD to your steel stamping process involves several steps. Here’s a practical approach to get the most value from these diagrams:
-
Obtain Accurate Strain Data:
Use grid marking or digital image correlation to measure the strains on your stamped part. The accuracy of your data directly affects the reliability of your analysis.
-
Plot Strain Points on the FLD:
Transfer the measured major and minor strain values onto the diagram. Each point represents the local deformation state of a specific area on your part.
-
Compare with the Forming Limit Curve:
Assess whether the plotted points fall below or above the FLC. Points below the curve indicate safe forming, while those above suggest a risk of failure.
-
Identify Critical Zones:
Focus on areas where strain points approach or exceed the FLC. These are your high-risk zones for necking or cracking and may require process adjustments.
-
Adjust Process Parameters:
If necessary, modify blank holder force, lubrication, or die geometry to bring critical strain points back into the safe zone. This iterative process helps optimize part quality and reduce defects.
Practical Applications and Benefits
Using forming limit diagrams in steel stamping offers several practical advantages:
- Defect Prevention: By identifying areas at risk of failure, you can proactively adjust your process to avoid cracks and splits.
- Process Optimization: FLDs support data-driven decisions for tooling design, material selection, and parameter settings.
- Cost Reduction: Minimizing scrap and rework leads to lower production costs and improved efficiency.
- Quality Assurance: Consistently producing parts within the safe forming zone ensures reliable performance and customer satisfaction.
For those interested in further technical details, exploring resources on steel stamping edge quality optimization can provide additional insights into improving part quality and process stability.
Common Challenges When Using Forming Limit Diagrams
While FLDs are valuable, several challenges can arise in real-world applications:
- Material Variability: Differences in steel grade, thickness, and coating can shift the forming limit curve, making it essential to use material-specific diagrams.
- Measurement Accuracy: Inaccurate strain measurements can lead to incorrect conclusions about formability.
- Complex Part Geometries: Parts with sharp corners or complex shapes may experience localized strains that are difficult to capture and interpret.
- Process Changes: Modifications in lubrication, temperature, or tooling can affect forming limits, requiring regular updates to your FLD analysis.
To overcome these challenges, maintain rigorous measurement practices and update your diagrams whenever you change materials or process parameters. For more guidance on working with different steel types, see our article on understanding the limits of steel formability.
Integrating FLDs into Your Stamping Workflow
Incorporating forming limit diagrams into your daily operations can streamline troubleshooting and continuous improvement. Here are some tips for effective integration:
- Train operators and engineers on the basics of FLD interpretation.
- Establish a routine for collecting and analyzing strain data on critical parts.
- Document process changes and update your FLDs as needed.
- Collaborate with material suppliers to obtain accurate forming limit data for each steel grade.
- Use FLDs alongside other quality tools, such as control charts and failure analysis reports, for a comprehensive approach to process control.
Additionally, always observe proper safety protocols when operating stamping equipment. For a detailed overview of safety measures, refer to recommended safety precautions for metal stamping machinery.
FAQ: Forming Limit Diagrams in Steel Stamping
What is the main purpose of a forming limit diagram in stamping?
The primary function of an FLD is to help engineers determine the maximum strain a steel sheet can undergo without failure. It visually separates safe forming conditions from those that may result in defects, guiding process adjustments and tooling design.
How often should forming limit diagrams be updated?
FLDs should be reviewed and updated whenever there are changes in material grade, sheet thickness, coating, or significant process parameters. Regular updates ensure that the diagram accurately reflects current production conditions and material properties.
Can forming limit diagrams be used for materials other than steel?
Yes, FLDs are applicable to a wide range of sheet metals, including aluminum, copper, and stainless steel. However, each material requires its own forming limit curve, as formability characteristics vary significantly between metals.
By mastering the interpretation and application of forming limit diagrams, you can enhance your steel stamping processes, reduce defects, and achieve consistent, high-quality results. For further reading, explore topics like how to choose between transfer and progressive stamping or best practices for stamping electrical steel to broaden your expertise in metal forming.